|
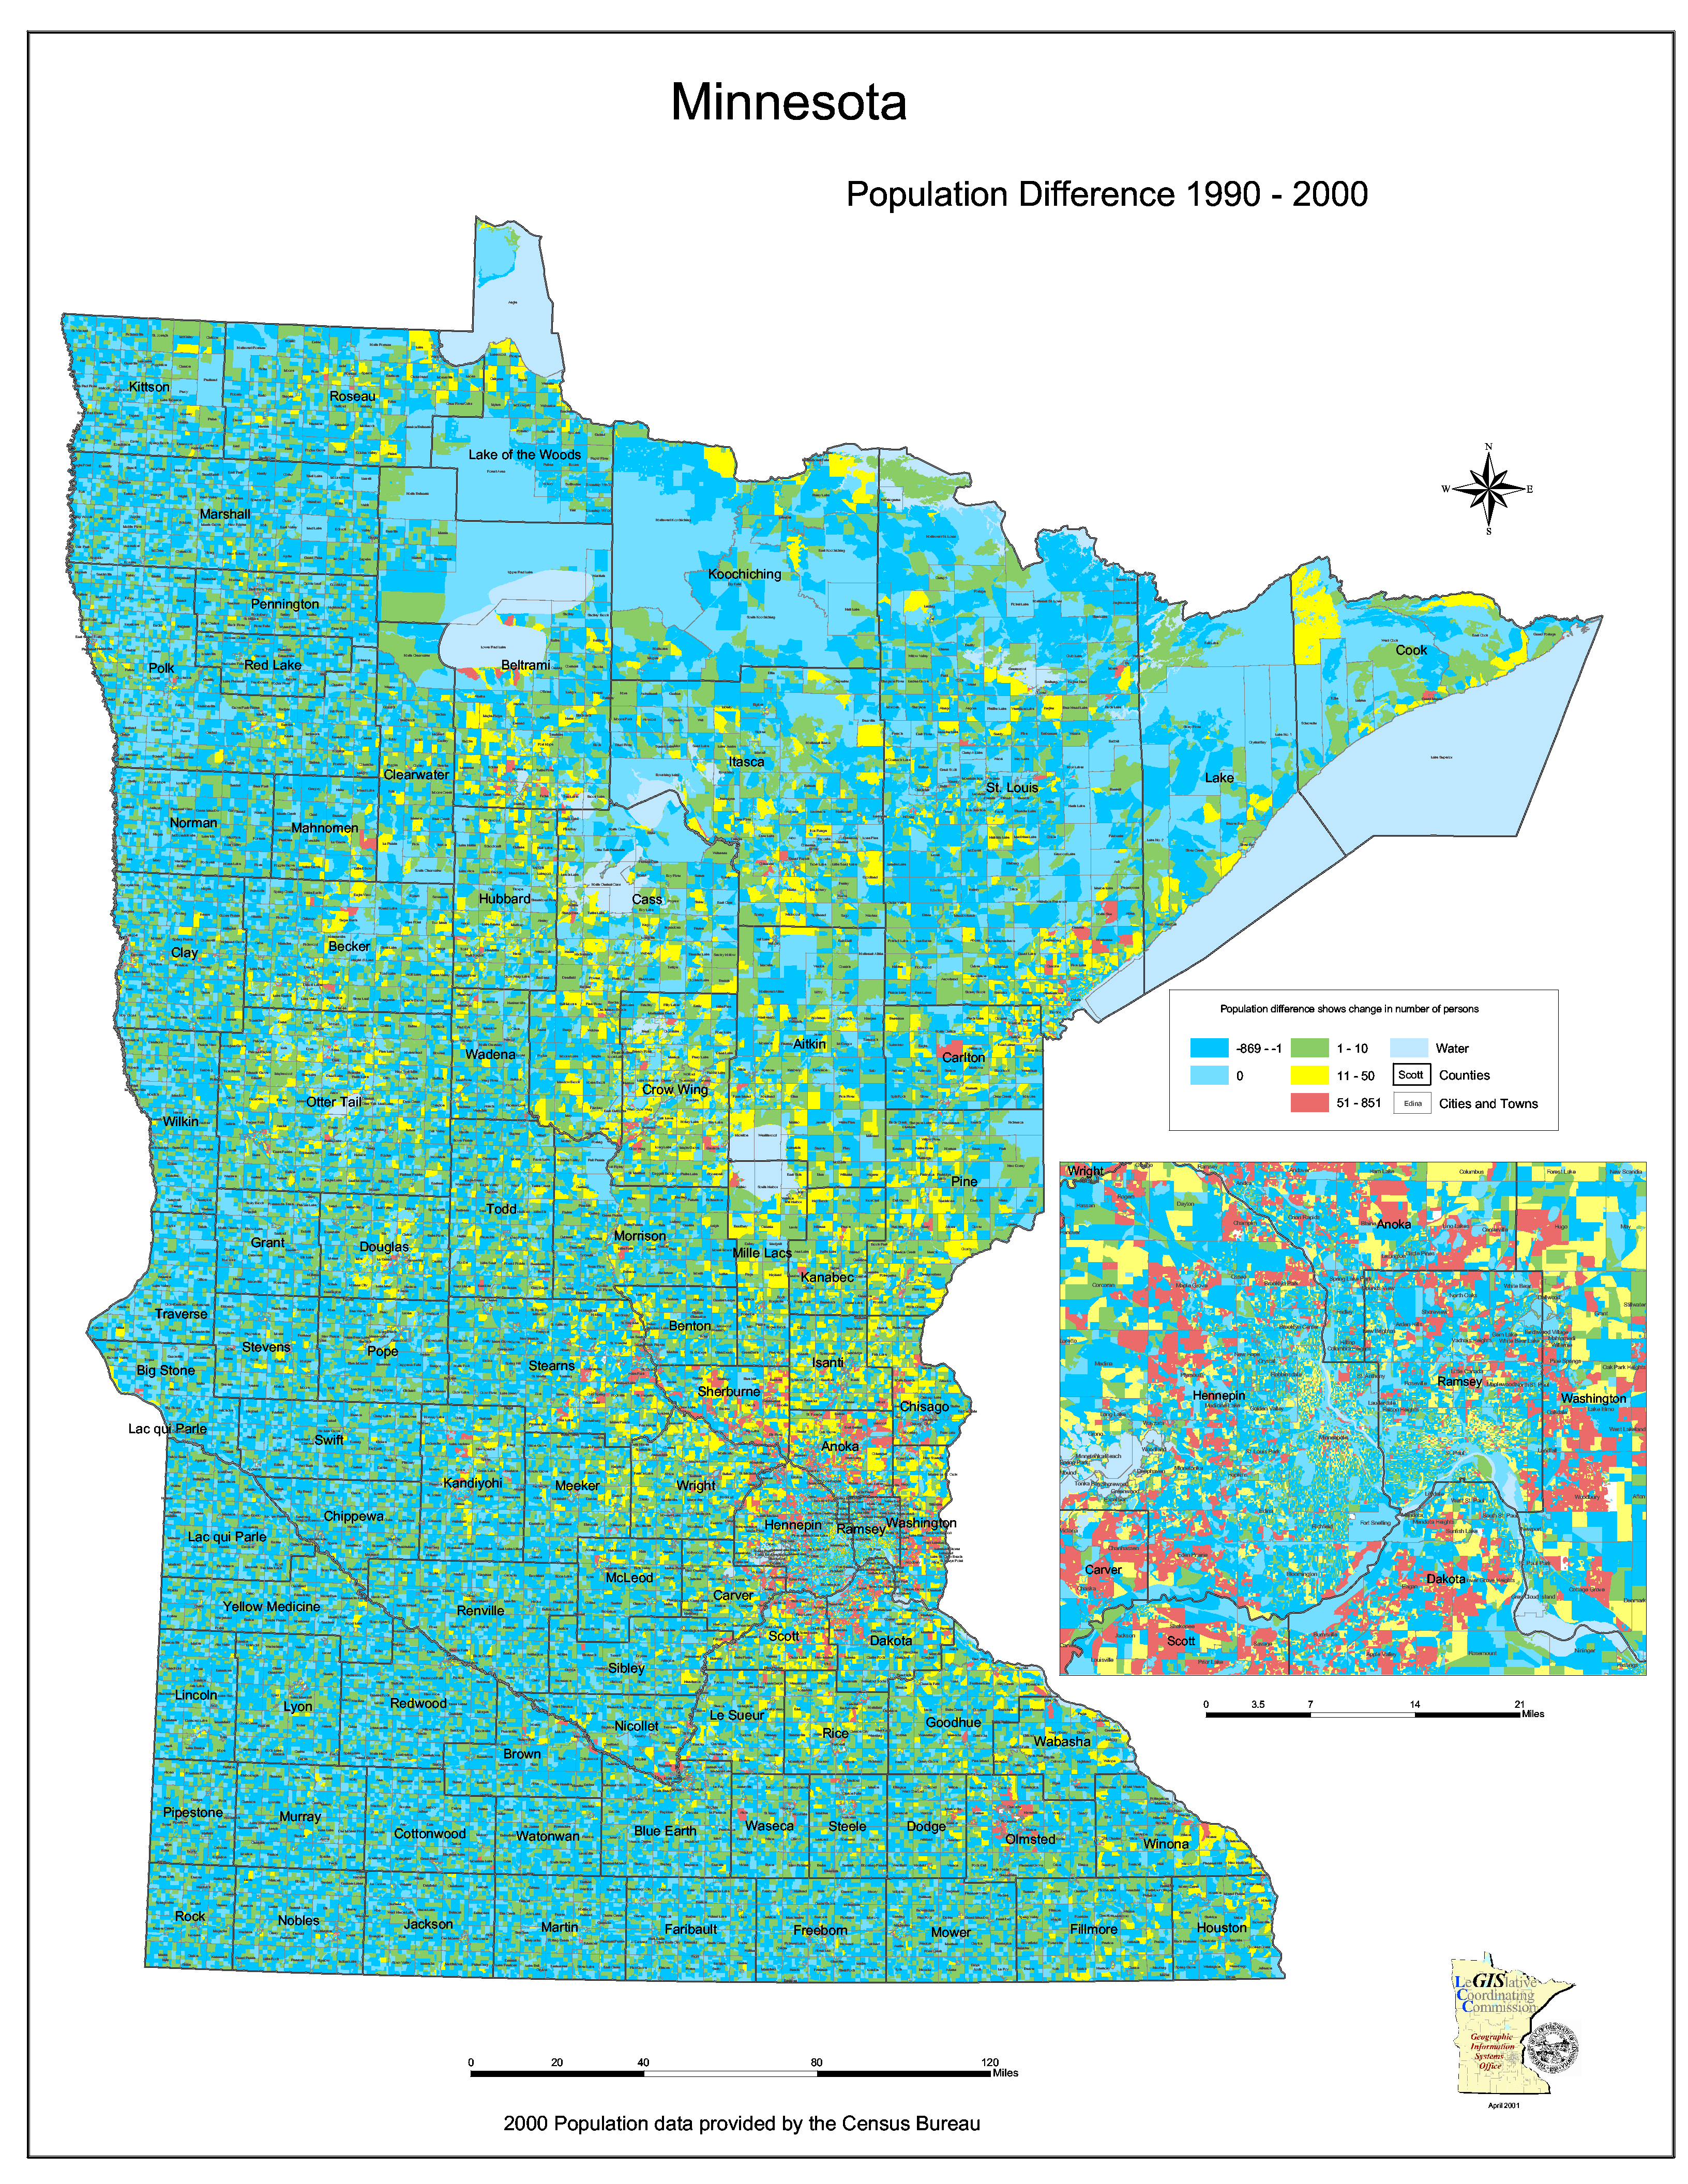
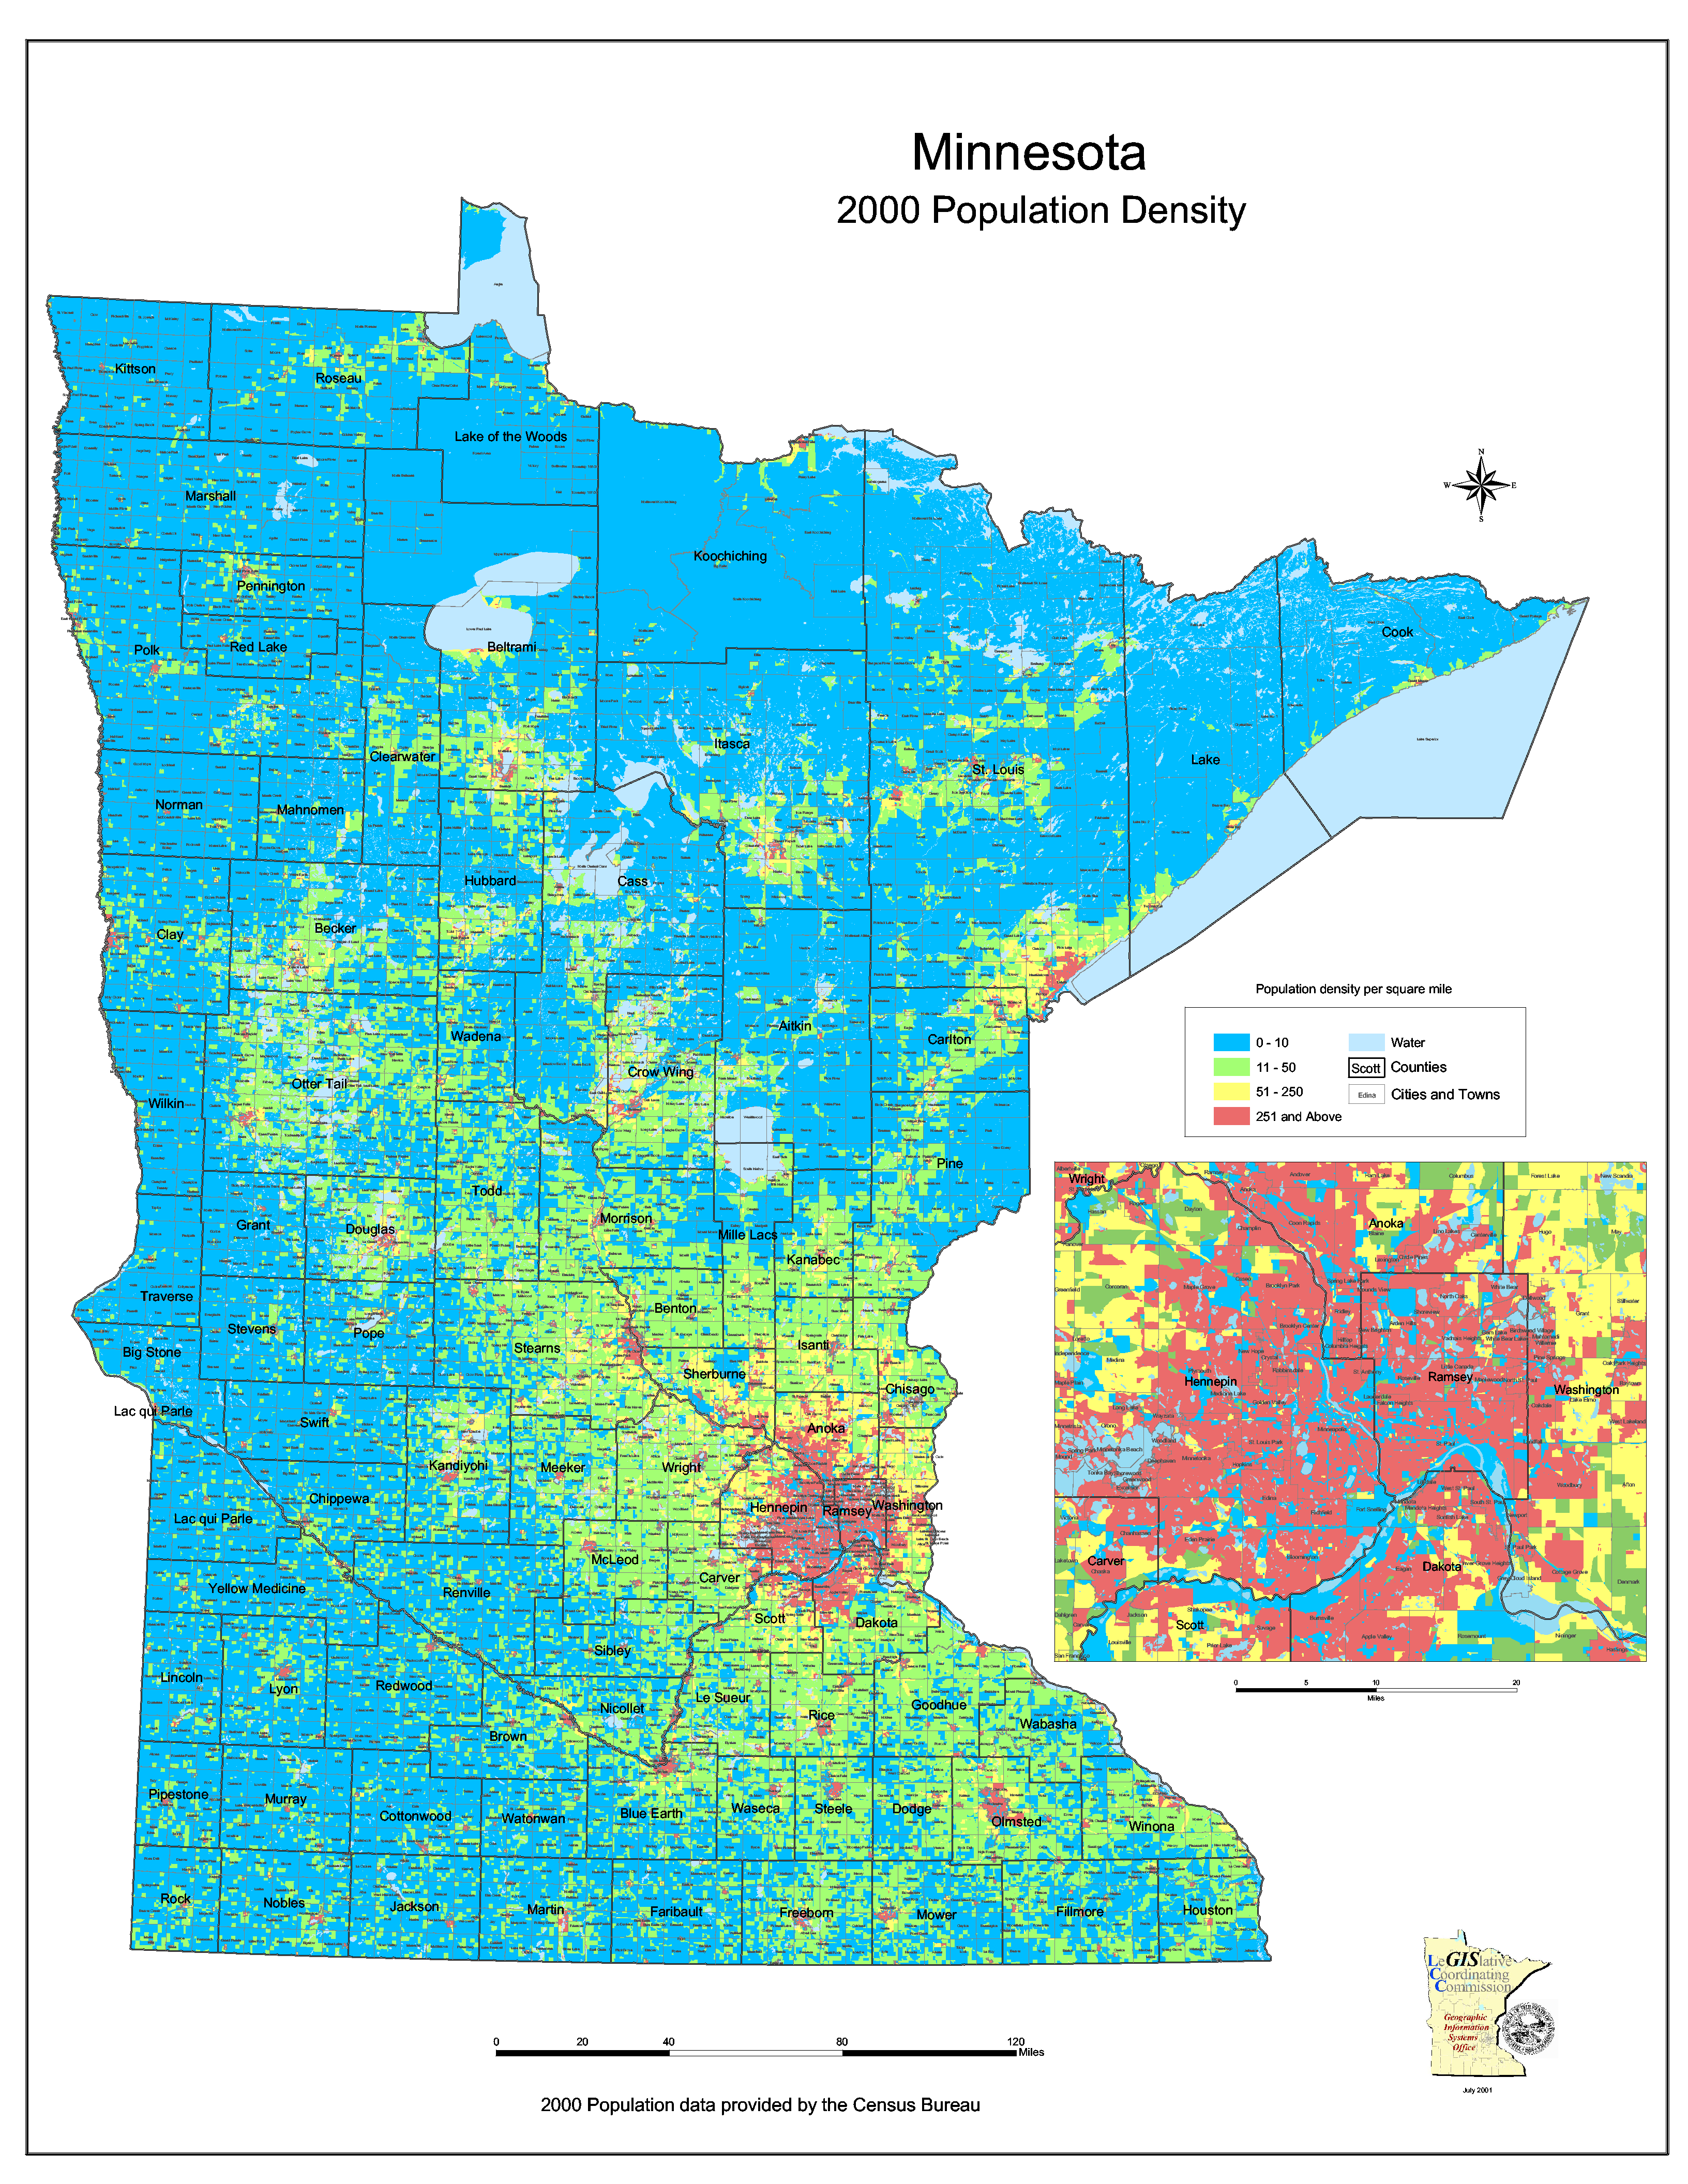
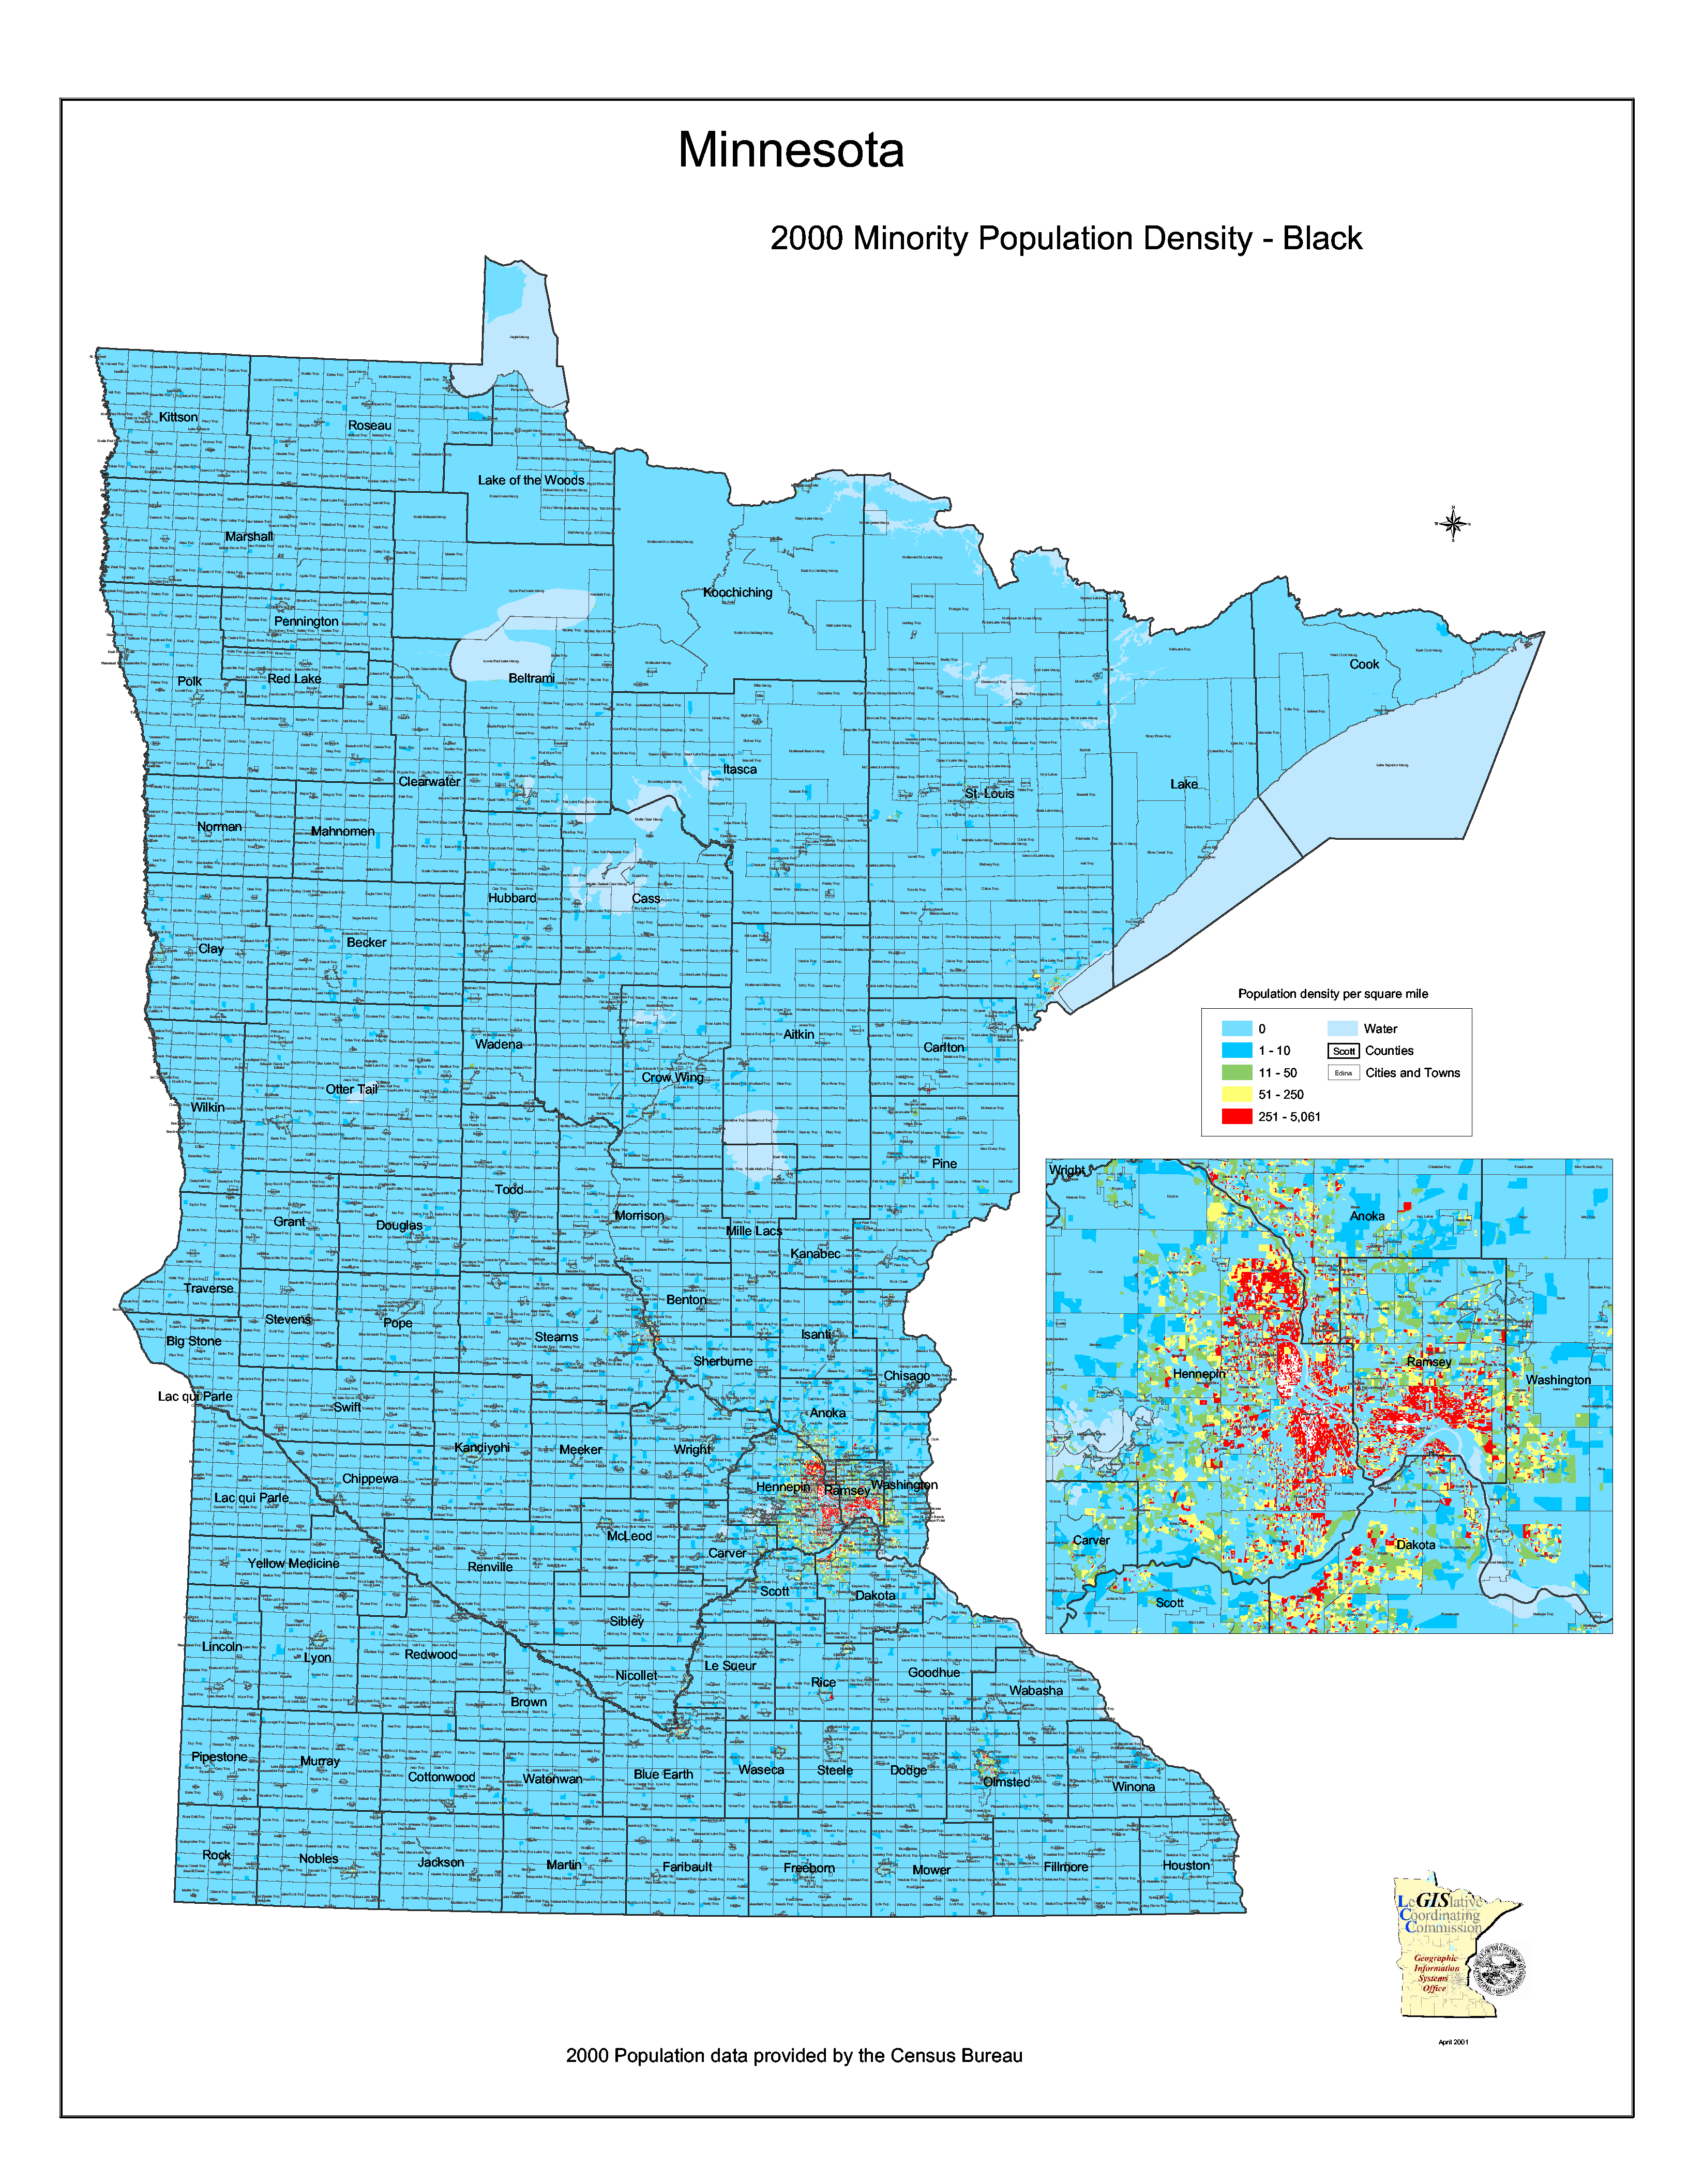
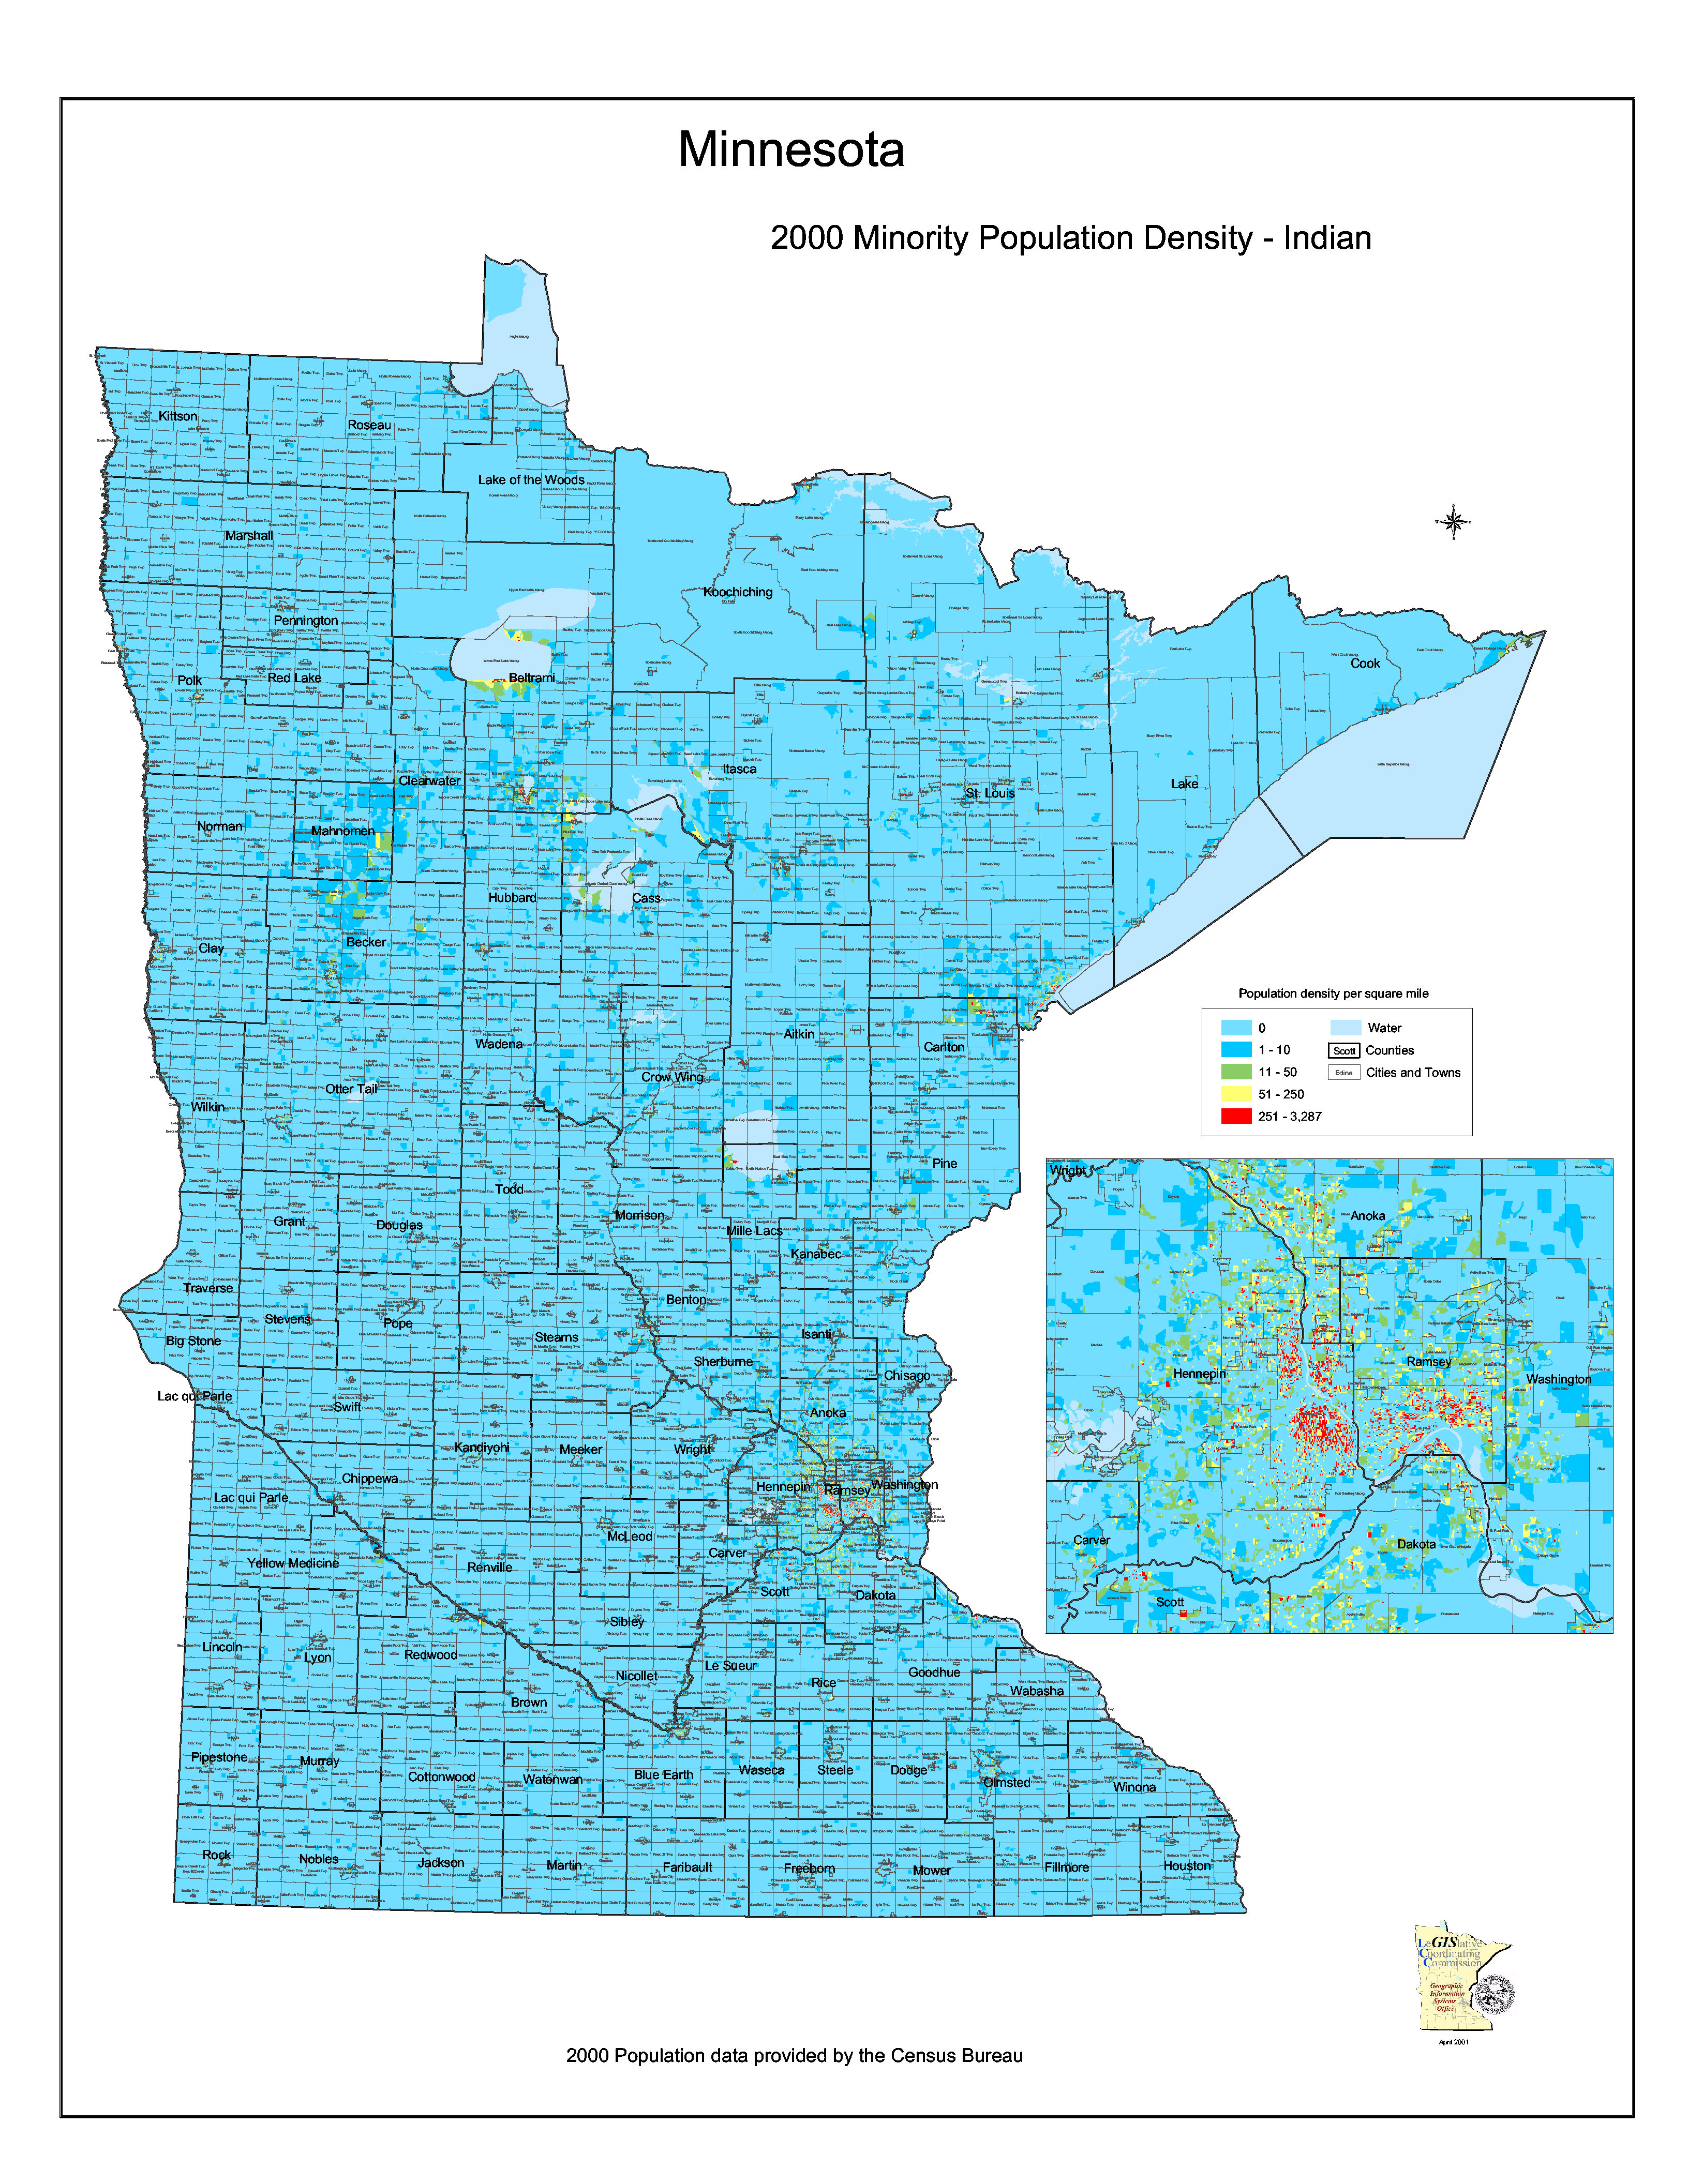
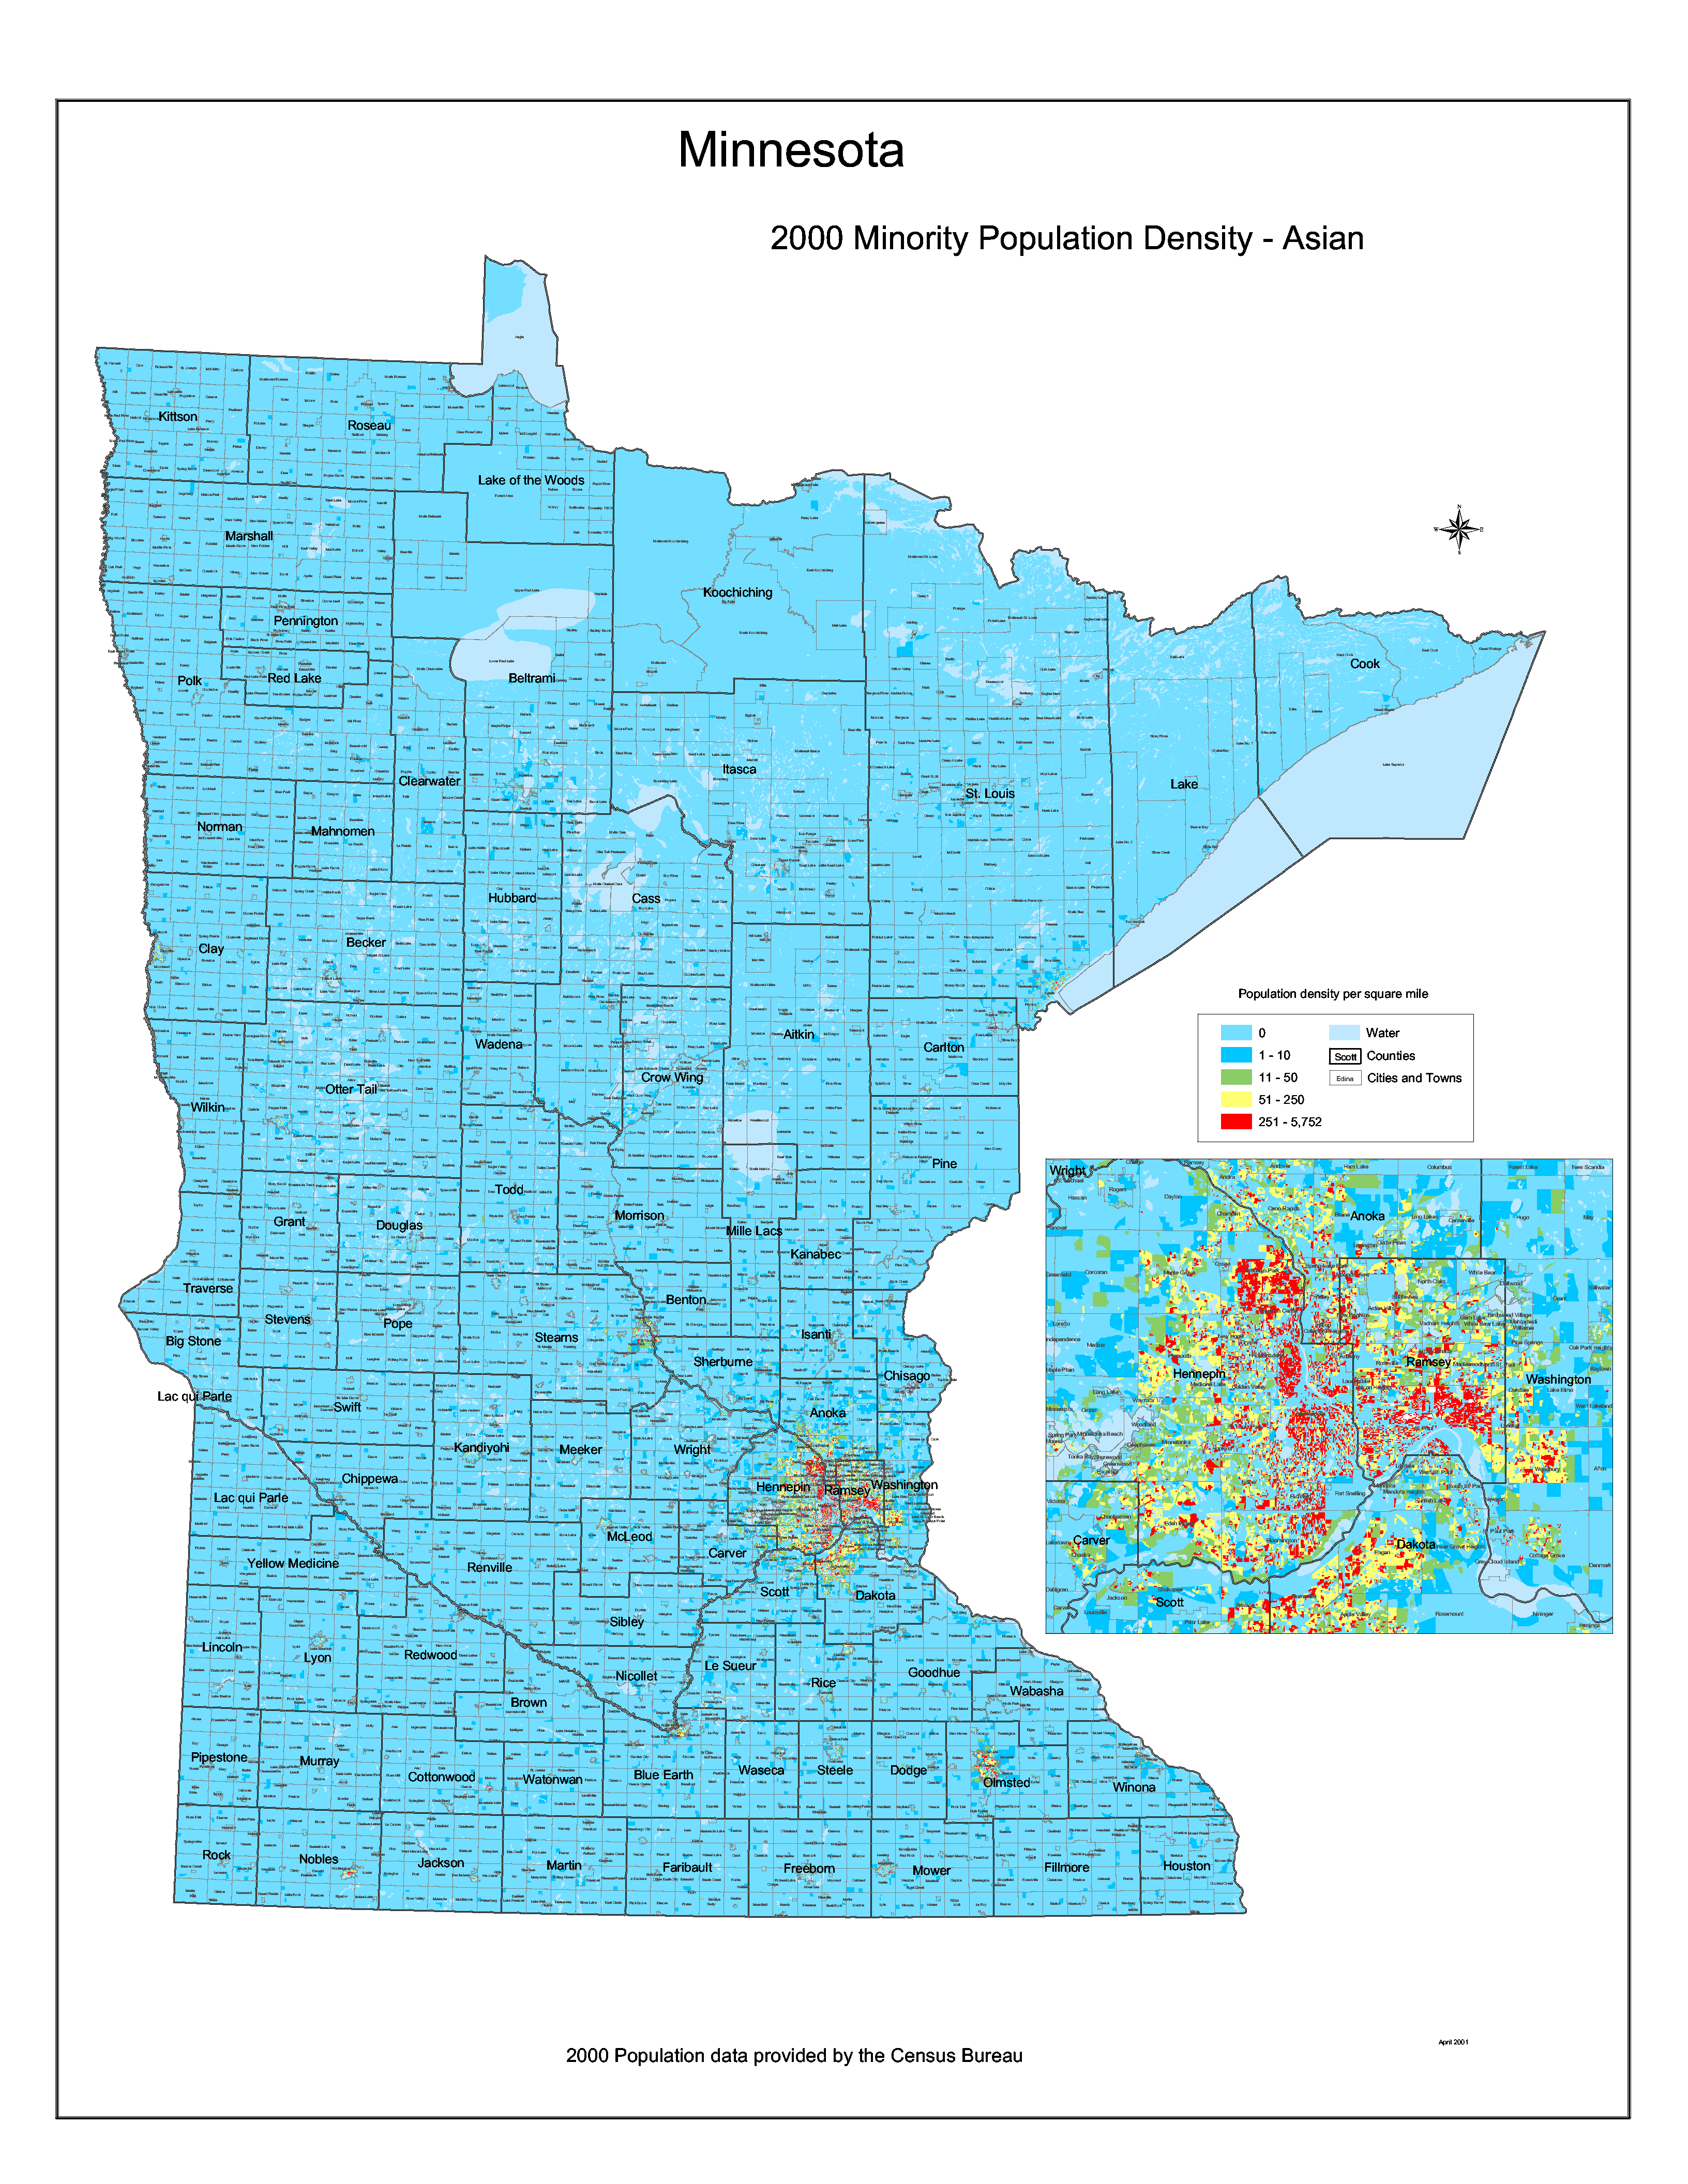
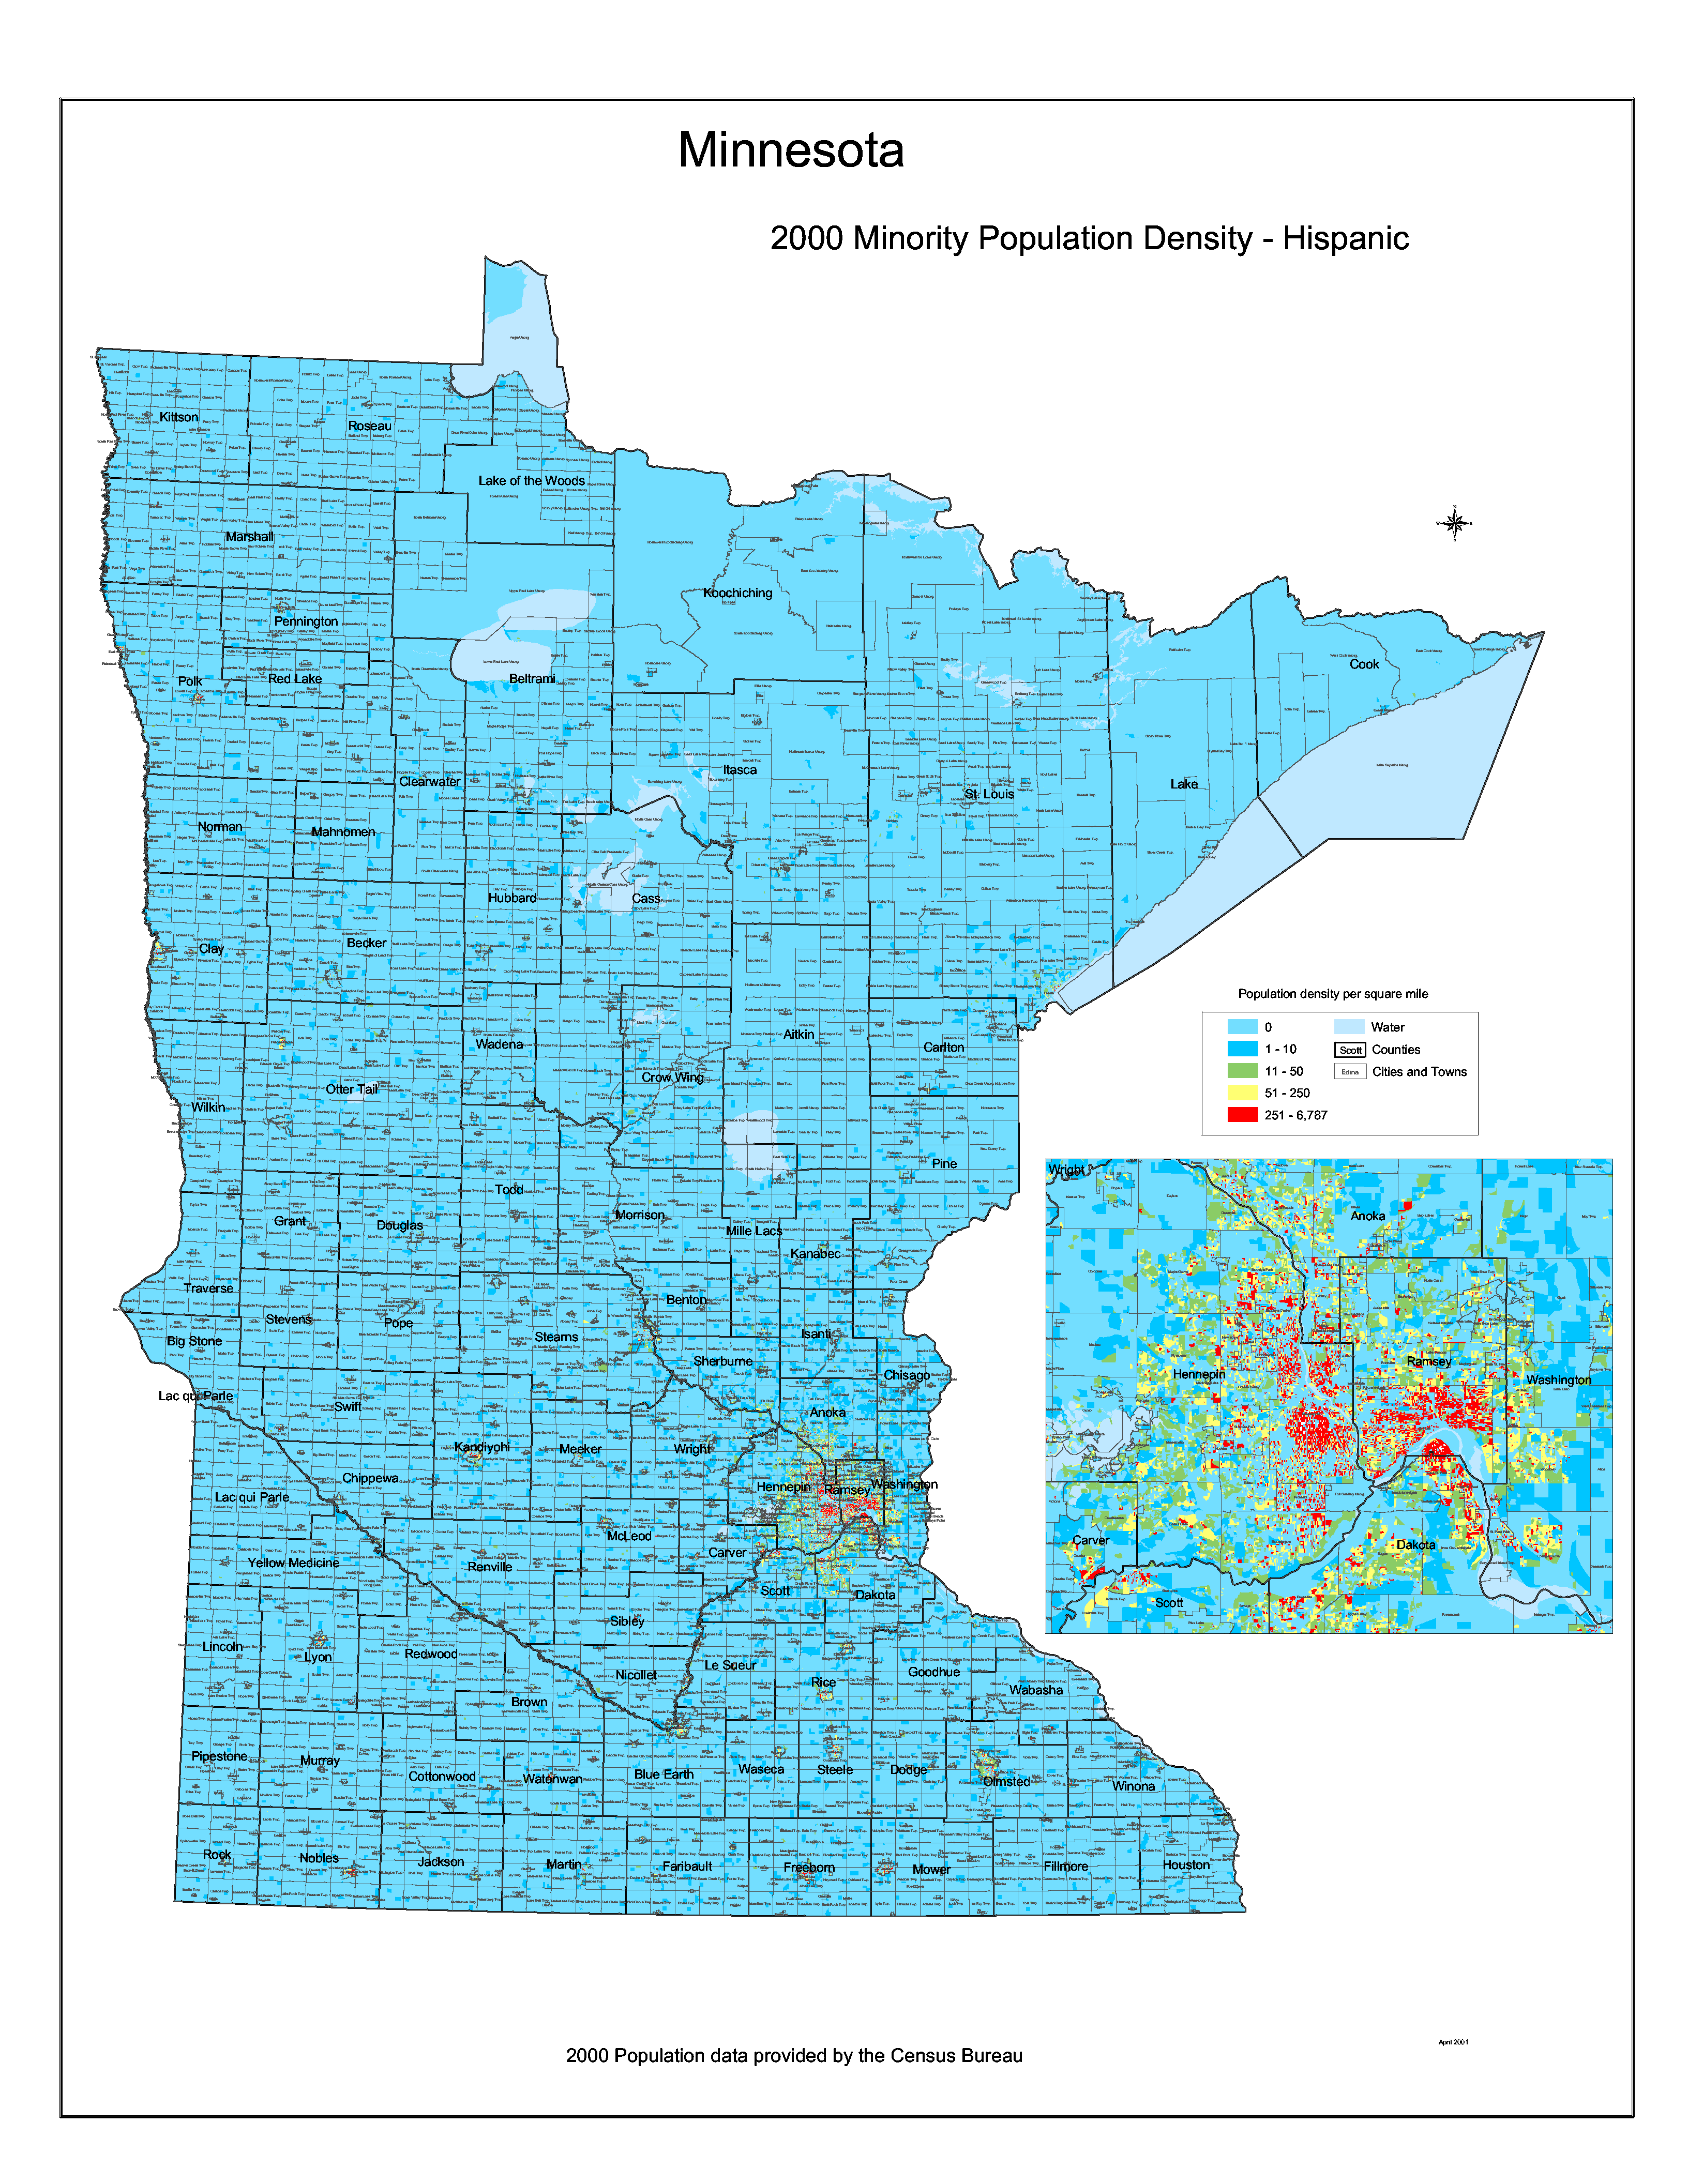
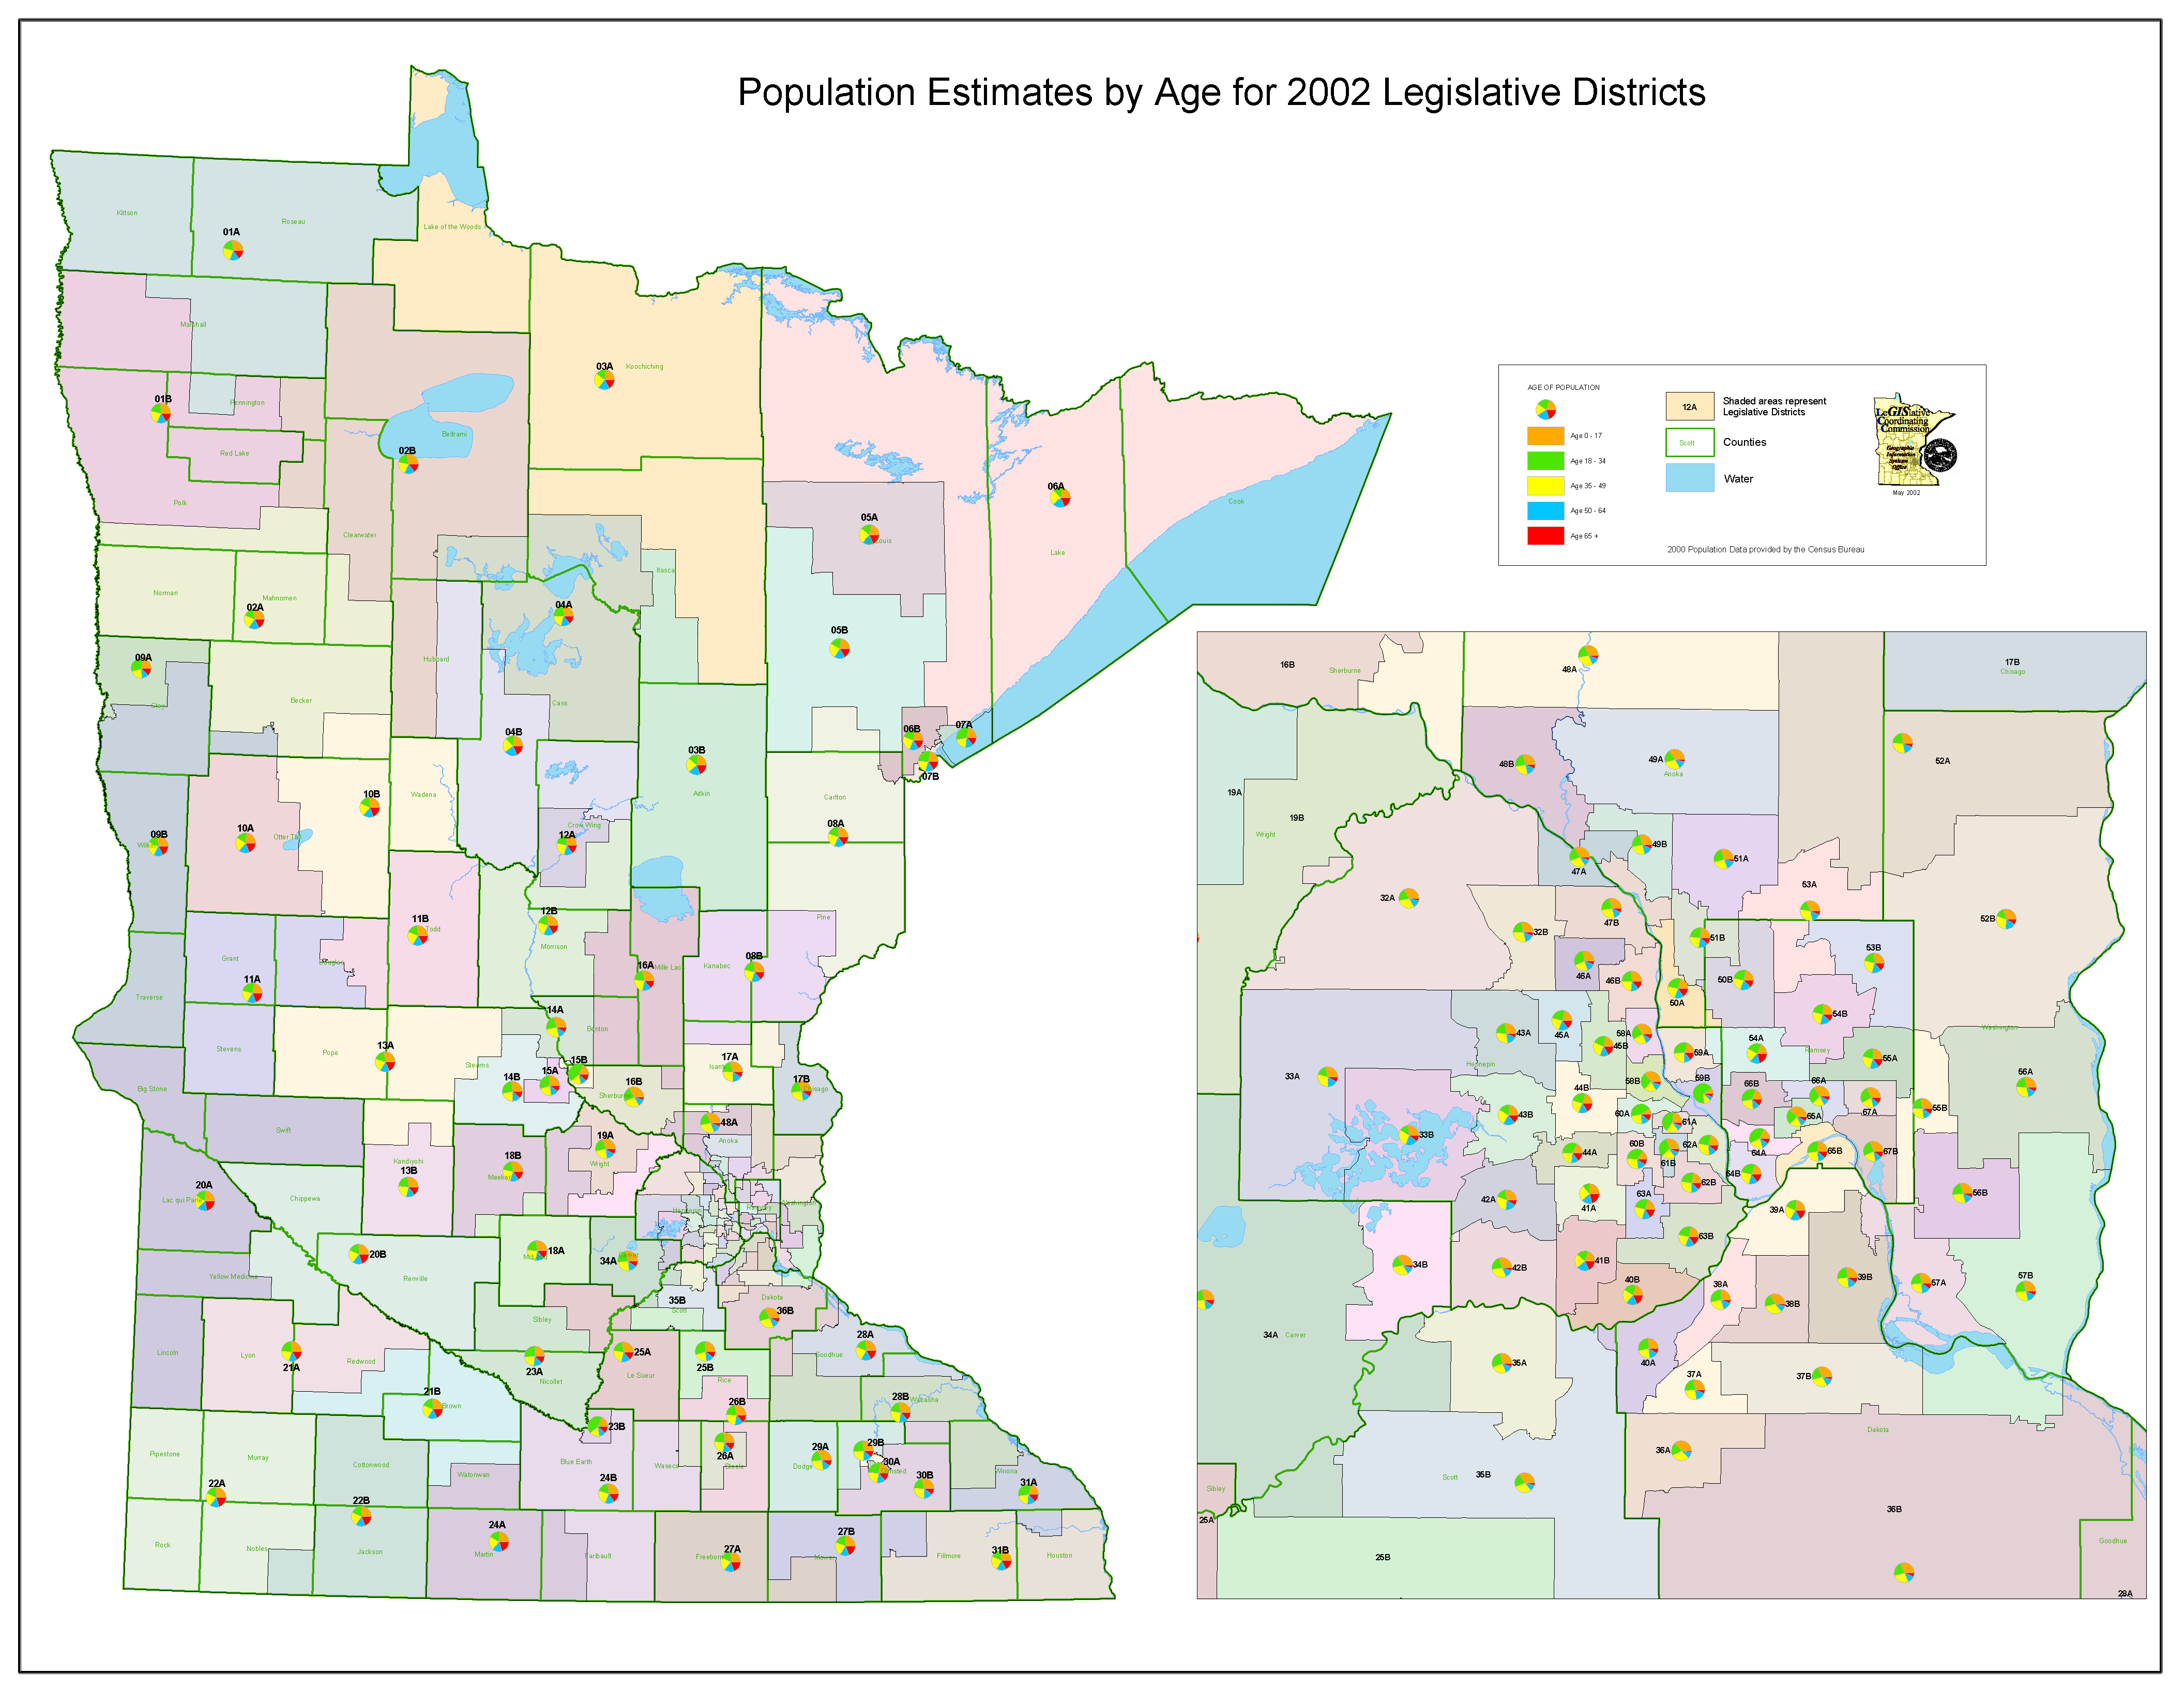
NOTE: PDF maps require Adobe® Acrobat® Reader 5. Download Adobe. Minnesota Population Change 1990-2000 PDF | PNG Size: 34" x 44", Color A map showing the population change in number of persons from the years 1990 to 2000 Minnesota Population Density 2000 PDF | PNG Size: 34" x 44", Color A map showing the population density per square mile during the year 2000 2002 Minority Population by House Districts PDF | BMP Size: 34" x 44", Color A map showing minority population as a percentage of total house district population 2002 Minority Population by Senate Districts PDF | BMP Size: 34" x 44", Color A map showing minority population as a percentage of total senate district population Minority Population Density Maps - maps showing minority population density per square mile during the year 2000 Size: 34" x 44", Color Size: 17" x 22", Color African American or Black PDF | PNG American Indian or Alaska Native PDF | PNG Asian PDF | PNG Hispanic or Latino PDF | PNG Median age by Legislative District PDF | PNG Size: 34" x 44", Color A map showing median age by 2002 Legislative District Population by Age for 2002 Legislative Districts PDF | BMP Size: 34" x 44", Color A map showing age breakdown for 2002 Legislative District populations Population by Age Groups for 2002 Legislative Districts - maps showing population age groups for 2002 Legislative Districts Size: 8,5" x 11", Black and White Age 0 - 17 PDF Age 18 - 34 PDF Age 35 - 49 PDF Age 50 - 64 PDF Age 65+ PDF Age 75+ PDF Send
comments regarding this site to: Last Updated: (am) |